It does not take too long after you are born to realize that some people are just different. Not weird different. Rich different. As we grow up, we may also realize that certain circles of people are just wealthier while certain circles just do not compare. It’s just the reality of things. However, wouldn’t you like to know why or how economic inequality forms in a society? You should! Because it is cool to know, plus it won’t even take long. So, read on:
Economic Inequality Definition
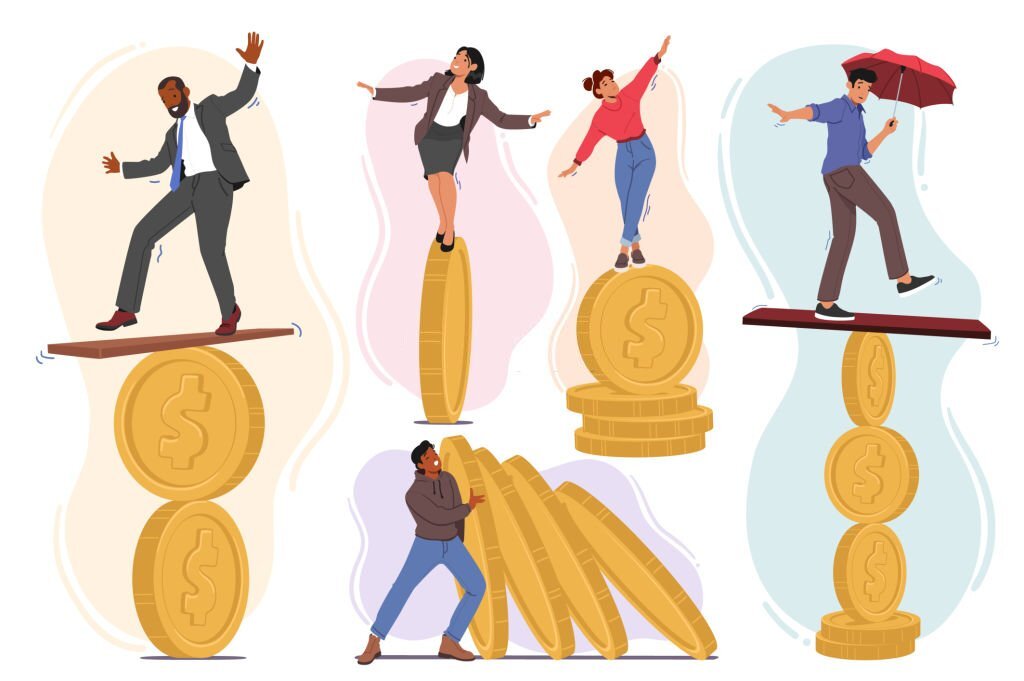
First of all, economic inequality is concerned with how some people are richer than others, and this is in simple terms. But, let’s look at things carefully like the economists we are
Take a country like the United States of America. This is one of the richest countries in the world, and still, there are poor people. The average household income in the USA in 2020 was $67,521. The poverty line is drawn at $13,590 for a family of one person.1 Comparing the two, we realize that the USA is miles above the international poverty line. Yet, there are still poor people in the USA. Why is this so? This represents economic inequality, which is the unequal distribution of income, wealth, and opportunity across different groups in society or a given population.
Economic inequality is the unequal distribution of income, wealth, and opportunity across and within groups in society. This concept can also apply to the unequal distribution of income and wealth across countries.
These groups in society can be age groups, racial groups, gender groups, or any other groups as long as they’re clearly defined.
Economic inequality is the representation of how some households earn below the poverty line while some others earn above it. Basically, the differences in income and wealth.
Economists group households into quintiles, and each quintile contains a fifth or 20% of the entire population. The quintiles are presented in order of poverty. Therefore, the first 20% or the first quintile represents those who are poorer than 80% of the population. The 20% above that, or the second quintile, represents those who are poorer than 60% of the population. This goes up three more times till we have those who are richer than 80% of the population.
Economic Inequality or Economic Disparity
So, you have heard economic inequality and economic disparity, and you were wondering what they were. Well, if you guessed that they were the same thing, you were right! Economic disparity is just a different way of saying economic inequality, which is the unequal distribution of income, wealth, and opportunities across different groups in society.
Economic disparity is just a different way of saying economic inequality, which is the unequal distribution of income, wealth, and opportunities across different groups in society.
Types of Economic Inequality
There are two types of economic inequality. These are income inequality and wealth inequality. First, let’s explain income inequality.
Income inequality is concerned with the differences in earnings of different groups in the economy. This means that it comes from wages, salaries, or even earnings on shares owned. If it is an earning, then it falls under income inequality.
Income inequality is the unequal distribution of earnings throughout a population.
This is different from wealth inequality, which is primarily concerned about ownership. Wealth inequality focuses on ownership of assets like cars, houses, businesses, and even shares, among others.
Wealth inequality is the unequal distribution of wealth throughout a population.
From this, we realize that people who earn the same level of income can have different levels of wealth. For example, some people may own more houses than other people who receive the same salary.
Economic Inequality Index
The inequality index will be explained here, but let’s first look at the visualization of economic inequality. Income inequality is visualized using the Lorenz curve. What the Lorenz curve does is that it basically shows the real distribution of income on a graph. It shows the cumulative percentage of the population on the x-axis against the cumulative percentage of income on the y-axis. Figure 3 shows the Lorenz curve for the USA.
The Lorenz curve is the graphical representation of income inequality in a population.
This can be quite confusing to understand, so let’s make it easier for you.
For instance, if the poorest 20% of the economy received exactly 20% of the income, this would mean that there is equality since each percentage of the population receives exactly the same percentage of income.
Economists usually want to summarize the level of inequality in a country, and they do this with the Gini coefficient. The Gini coefficient is also known as the Gini index or the economic inequality index. The easiest description of the Gini coefficient is in Figure 3 above. If the area between the Lorenz curve and the inequality line is larger, the Gini coefficient is larger. It basically measures the distribution of income.
The Gini coefficient is a summary number of how uneven the income distribution is for a given population. The higher the number, the more unequal is the income distribution.
As you can see, both the Lorenz curve and the Gini coefficient are used to represent inequality in a given population. They can also be used to compare the levels of inequality across different populations.
Causes of Economic Inequality
Let’s explain the why and how of economic inequality. There are a number of causes of economic inequality; some of these are explained here.
- Each factor of production gets paid the value of its marginal product – To explain this simply, if capital has a higher marginal product in industries than labor, the households that supply the capital will earn more than the households that supply the labor. In other words, capital owners will earn more than workers in these industries.
- Differences in tax structures – Here, a regressive tax structure creates a situation where lower-income earners pay higher percentages of tax on their income compared to higher-income earners.
- Human capital – Here, two workers may have the same qualifications, but the worker with more experience can earn more than the other with less experience.
- Social capital – People with powerful social connections are in a better position to exploit economic opportunities.
- Inheritance – People are born automatically richer if they are born into wealthy families.
- Discrimination – This refers to several types of discrimination, racial, gender-based, or any other type of discrimination that affects how workers are valued.
- Access to financial markets – Here, the richer you are, the more likely you are to be granted a loan or given credit. This widens the inequality gap between the rich and the poor since the poor do not have as much access to loans, insurance, credit, and other financial services.
- Bargaining power within economic and social units (firms, families, and so on) – For example, the labor union is a way for workers to increase their bargaining power within a firm. Labor unions are able to bargain for higher wages since they control the supply of labor to an extent. Therefore, a stronger labor union for drivers may bargain for higher wages, whereas a weaker union for a different profession may receive lower wages.